DBB Guidebook - Analysis
The evaluation of measurement is mainly based on the formulaes of Kakino. The deviation types are evaluated by fitting the captured measurement data to the deviation prototypes calculated by those formulaes.
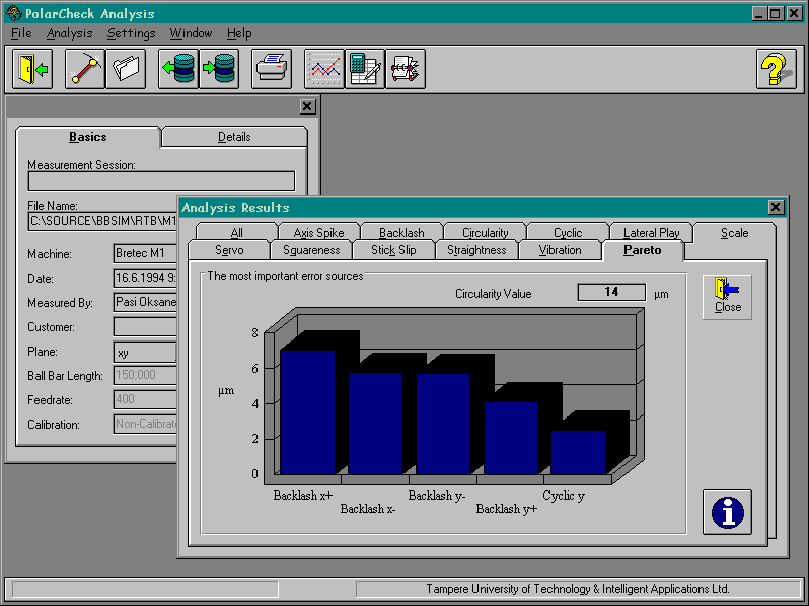
You can either analyse the measurement just after a capture or read it later from the database or a file. This analysis is performed simply just by pressing the 'Results'-button on the toolbar or by selecting from 'Analysis' menu 'Results' item. Here below you can see a window which is opened after calculations needed to analyse the measurement:

Results folder
The most important deviations, causing the most serious problems in a machine tool, are presented in the bar graph shown in the first page. The results can be seen also in numerical form by clicking the corresponding tab on the folder. If you want to know more information on some specific deviation type you can click the 'Info'-button to open a context sensitive on-line help. To compare the results shown by the program and the real measurement it is possible to open so called 'Analysis graph window' from 'Analysis' menu.

Analysis graph
If the graph on the left window differs significantly to the graph on the right window tells this that there is some deviation type not understood by the analysis program on your machine tool. But in most cases the graphs look similar and you can trust on the analysis result. When the measurement is now succesfully analysed, you can save it to the database for future use by pressing the 'Save' button.
Look at analysis teaching video... (1.2MB AVI)